Traffic flow as an early indicator for GDP growth
Edward Rowland
Big Data - Methodology
Jessica Lawrence, Nathan Davis, Anthony Fitzroy and Ben Vince
Data Engineering - DaaS
Duncan Elliot
Time series analysis - Methodology
Office for National Statistics, UK
# source: https://stackoverflow.com/questions/27934885/how-to-hide-code-from-cells-in-ipython-notebook-visualized-with-nbviewer

HTML('''<script>
code_show=true;
function code_toggle() {
 if (code_show){
 $('div.input').hide();
 } else {
 $('div.input').show();
 }
 code_show = !code_show
}
$( document ).ready(code_toggle);
</script>
<form action="javascript:code_toggle()"><input type="submit" value="Click here to toggle on/off the raw code."></form>''')
#source: https://stackoverflow.com/questions/9031783/hide-all-warnings-in-ipython
from IPython.display import HTML

HTML('''<script>
code_show_err=false;
function code_toggle_err() {
 if (code_show_err){
 $('div.output_stderr').hide();
 } else {
 $('div.output_stderr').show();
 }
 code_show_err = !code_show_err
}
$( document ).ready(code_toggle_err);
</script>

<form action="javascript:code_toggle_err()"><input type="submit" value="Click here to toggle on/off warnings."></form>''')
Talk Structure
- Background
- Other research
- High Frequency traffic counts
- Supervised learning models
- Discussion
Other things I may not have time to talk about but are in these slides
- Future direction with some more time series analysis
- Correlations and time series models with annual data
- Trends and seasonal decomposition of daily traffic counts
Background
Traffic flow is thought to be elastic to a number of economic factors
- GDP: More stuff being made that needs to be moved about
- Salary: More money means people might travel more for work, business and leisure
- Employment: More people in work may mean more commuting
- Inflation: If the cost of living goes up, that might mean less traffic as people cut back on expenses
How is this useful?
1. More localised estimates
Identify areas of low or negative growth that would be lost if looking at the national figures
2. Potential early indicator
A recession is defined as having two or more quarters of negative GDP growth.
The UK won't officially know if it is in recession until around 6-7 months after it started.
3. Identify impacts of specific events
With high frequency data, it could identify the impacts of events (Weather, terrorist attacks, Brexit etc.)
Work from other NSIs
Stats Netherlands
Research using data from an extensive road sensor network in The Netherlands shows correlations with traffic flow and a number of economic measures with a lag of 3 months
| Measure | Total Traffic | Cat 1 (< 5.6m) Traffic | Cat 2 (5.6m =< >= 12.2m) Traffic | Cat 3 (> 12.2m) Traffic |
|---|---|---|---|---|
| Inflation | -0.42 | -0.43 | - 0.19 | -0.43 |
| Unemployment | -0.47 | -0.41 | -0.55 | -0.22 |
| Income | 0.74 | 0.74 | 0.45 | 0.65 |
| GDP | 0.54 | 0.63 | -0.01 | 0.70 |
- Income followed by GDP look to be the strongest correlates
- Larger vehicles (HGVs) correlate most strongly with GDP
- Perhaps some weaker correlations with inflation and Unemployment
Killan, Ros, "Road Traffic Correlations with Economic Variables: The Big Data Perspective., 2017, https://pdfs.semanticscholar.org/1f1d/b563d229bdd4fd8c90ad8dd6c5cd3487f76b.pdf
Statistical Office of the Republic of Slovenia (SURS)
- Used traffic flow to estimate GDP figure 45 days before its publication.
- PCA with linear regression to estimate GDP
- Found that cargo vehicles were the best predictor of GDP, within 1% of the GDP figure
Črt Grahonja, 2018, Use of alternative data sources as flash estimates of economic indicators, European conference on quality in official statistics June 2018: https://www.q2018.pl/papers-presentations/?drawer=Sessions*Session%2022
Statistics Finland
- Uses Company level data and traffic loops to produce two nowcasts and a 16-day backcast of GDP
- Reduce factors by two-step PCA and shrinkage step
- 16 day backcast was as accurate as the first estimate of GDP when comparing both to the revised figure
- Traffic flow and company data were similar when estimating GDP
Henri Luomaranta, 2018, Nowcasting Finnish Real Economic Activity: a Machine Learning Approach, European conference on Quality in official statistics June 2018: https://www.q2018.pl/papers-presentations/?drawer=Sessions*Session%2022
High frequency traffic flow data
Highways England data
Highways England provides an open dataset containing traffic flow counts at 15 minute intervals for Motorways and major A-Roads across England.
The Data Engineering team in DaaS have scraped and ingested this data
- Over 2 million separate files
- Over 200Gb of data
- Separates out small (< 5.6m), medium (5.6 - 6.6m), large (6.6 - 11.6m) and very large (> 11.6m) vehicles
Really exciting high frequency dataset - ideally suited for this work
- Look at the approaches used in Slovenia and Finland
- Previously we have replicated correlations found by Stats Netherlands using annual data
Data processing
Make the data manageable
- Aggregate to give mean traffic count for a 15 minute period across the UK for each day
- Created features by decomposing the data to find trend and yearly seasonal components as well as moving averages
- For supervised learning, create a feature for each traffic variable for each day in time period
- Compare this to quarterly GDP
Modelling
A range of different approaches were used including...
- SARIMAX - with a variety of different quarterly weighted average traffic flow measures as exogenous regressors
- PCA for decomposition and linear regression with and without shrinkage methods
- PCA for decomposition and Random Forest Regression
- 3-fold cross validated Grid Search used for parameter optimisation for supervised learning methods
Ridge regression looked to be the "best" model of these
IFrame("figures/full_ts_ridge_model_small.html",
       width=1000,
       height=600)
Why did this fail?
The approaches used here are similar to the work carried out in Finland and Slovenia.
Data time period used by...
- Stats Netherlands: 2011 - 2016
- Statistics Finland: 2013 - 2018
- SURS: 2011-2018
- ONS, UK: 2006 - 2014
... only one of these includes a global financial crisis. Let us see what happens when we try this with data from 2010-2014.
IFrame("figures/no_rec_ridge_model_small.html",
       width=800,
       height=600)
Model 1
| Metric | Value | Fitted to | Tested on | Features |
|---|---|---|---|---|
| MSE | 0.353 | 2006-2014 | 2006-2014 | 7 day moving average |
| R squared | 0.354 | 2006-2014 | 2006-2014 | 7 day moving average |
Model 2
| Metric | Value | Fitted to | Tested on | Features |
|---|---|---|---|---|
| MSE | 0.137 | 2006-2014 | 2010-2014 | 7 day moving average |
| R squared | -0.126 | 2006-2014 | 2010-2014 | 7 day moving average |
Model 3
| Metric | Value | Fitted to | Tested on | Features |
|---|---|---|---|---|
| MSE | 0.024 | 2010-2014 | 2010-2014 | Trend and seasonal components |
| R squared | 0.796 | 2010-2014 | 2010-2014 | Trend and seasonal components |
That looks a lot better!
Summary
- It is quite "easy" to produce reasonable estimates of GDP with traffic flow data, when there is no recession
- This replicates results found by other NSIs
- Making predictions about the real world events that drastically deviates from the norm is "hard"
Take home: be very careful
If nowcasts/flash estimates from these data sources are used by then it is possible they will not be able anticipate drastic changes, like a recession.
This means your model may fail, just when policymakers and buisinesses need them the most.
In turn, this could introduce complacency - worse than if your estimations didn't exist
What can we do then?
Try some other economic indicators?
- Average salary
- Unemployment
- Imports and exports
Well the data we have means we may be able to solve this problem.
We have only scratched the surface, there may be a recession "singature" in the data. With careful decomposition and analysis we may be able to find it, such as...
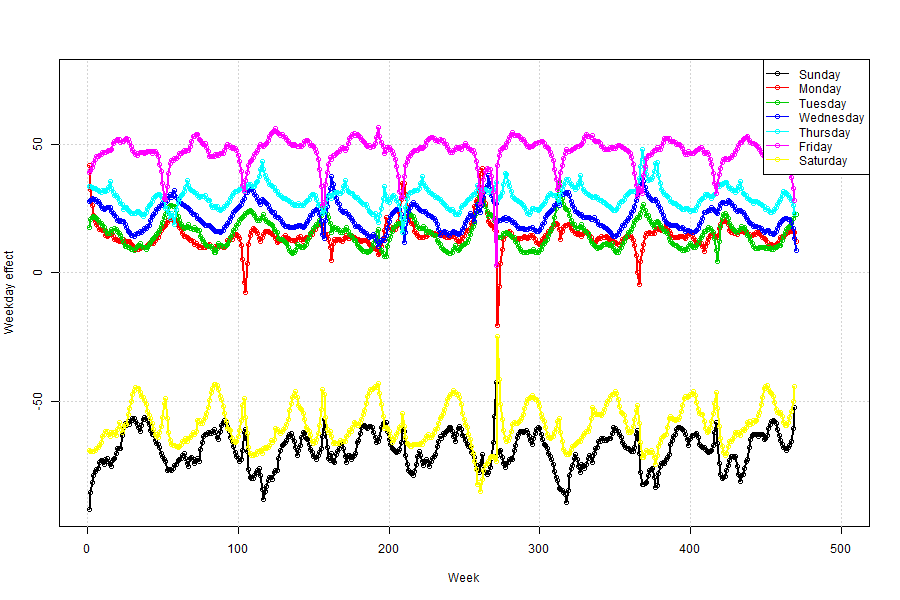
Time series features
Daily
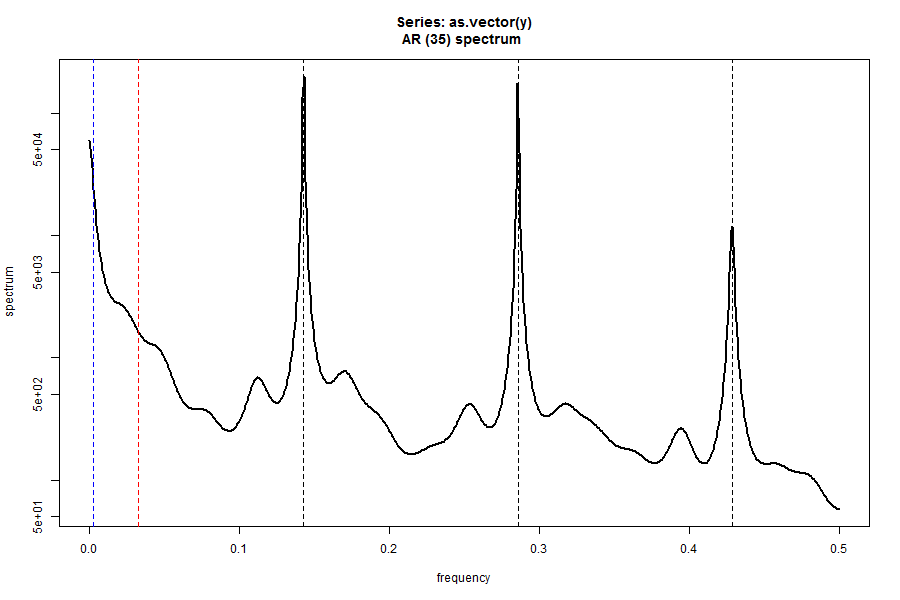
Monthly
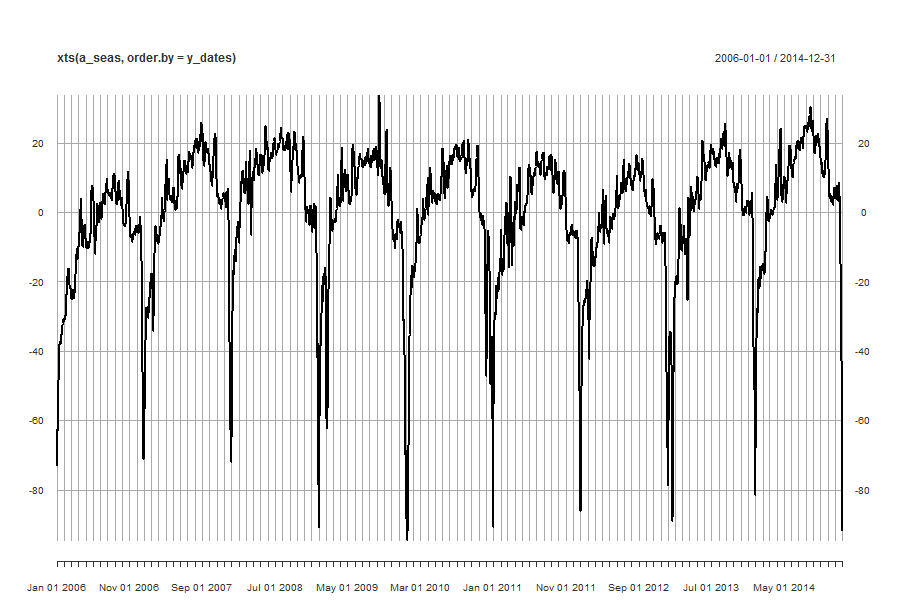
Residuals around easter
easter_df
Significant days
Including the effects of rain and temperature
days_df.sort_values("Coefficient")
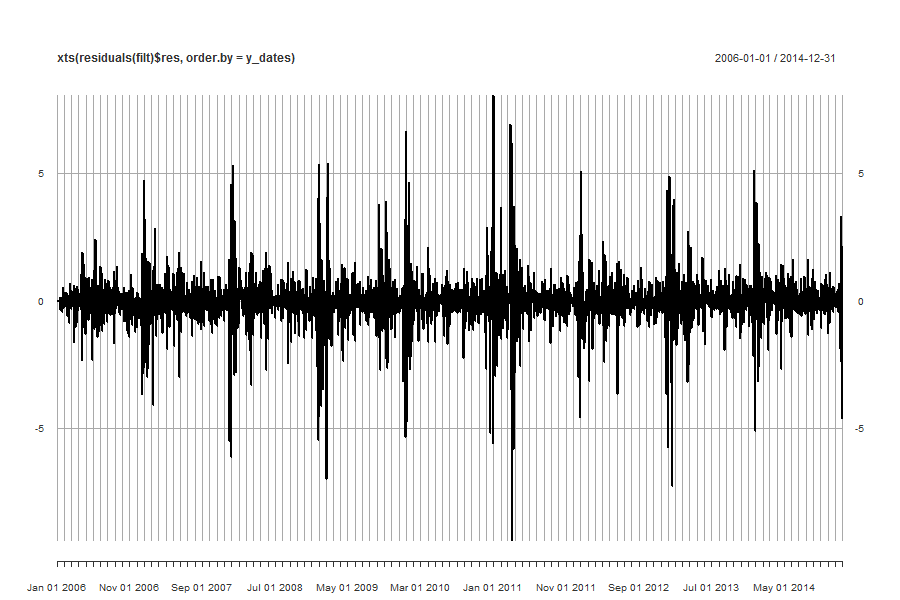
Residuals
Even with all of the above, there is still a lot of unexplained structure in the time series
Thank you for listening
See these slides again!
Gitpages : https://onsbigdata.github.io/RSS-2018/
Github repo: https://github.com/ONSBigData/RSS-2018/
Email: edward.rowland@ons.gov.uk
Data - Traffic flow
Data - Economic and labour market measures
Annual figures are taken to match with traffic flow
- GDP: The measure used here is the National GDP growth figure as contained in the UK National Accounts Blue Book.
- CPIH: The annual UK Consumer Price index including owner occupied housing costs is used here. Note that this time series only dates to 2005, so no figure is available before this date
- CPI: The annual UK Consumer Price index is used here as CPIH is not available before 2005
- Unemployment: The seasonally adjusted UK unemployment rate for over 16s is used here
- Earnings: Average weekly earnings is the figure used that gives the money paid per week, per job before tax and other deductions to employees in the UK
Correlations with annual measures
Pearson's correlations of AADF traffic and economic measures lagged by one year
Coefficents
Department for Transport data
- Annual average daily flow (AADF) for major and minor roads is used as a measure of traffic flow from 2003 to 2015
- Split into different vehicle categories
- Daily flow is the number of vehicles passing a point on a road on a day. This is averaged across the year to produce the average daily flow
- This measure is based upon approximate 10,000 manual counts per year, between March and October on non-school and public holidays
- These counts are used to estimate AADF figures for major roads
- A representative sample of minor road sites are selected as observations points
- These figures are combined with the change on the previous year to estimate counts for all minor roads
| Economic indicator | CPI | Change in unemployment (% pts) | Change in weekly earnings (£) | GDP Growth |
|---|---|---|---|---|
| Vehicle type | ||||
| All HGVs | 0.08 | -0.15 | 0.95 | 0.51 |
| All Motor Vehicles | 0.09 | -0.50 | 0.83 | 0.76 |
| Buses and Coaches | 0.11 | -0.56 | 0.72 | 0.76 |
| Cars and Taxis | 0.10 | -0.46 | 0.84 | 0.77 |
| LGVs | -0.05 | -0.67 | 0.18 | 0.44 |
| Motorbikes and Scooters | 0.07 | 0.12 | 0.83 | 0.26 |
| Pedal Cycles | 0.04 | -0.57 | -0.18 | 0.37 |
Stats Netherlands
| Measure | Total Traffic | Cat 1 (< 5.6m) Traffic | Cat 2 (5.6m =< >= 12.2m) Traffic | Cat 3 (> 12.2m) Traffic |
|---|---|---|---|---|
| Inflation | -0.42 | -0.43 | - 0.19 | -0.43 |
| Unemployment | -0.47 | -0.41 | -0.55 | -0.22 |
| Income | 0.74 | 0.74 | 0.45 | 0.65 |
| GDP | 0.54 | 0.63 | -0.01 | 0.70 |
Time series models
Approach
- Try some basic Auto-regressive (AR) models
- These contain one variable, where you are trying to predict future values from past (lagged) values
- These shouldn't work well, otherwise it would be easy to predict GDP etc!
- Add in All Vehicles variable in a Vector AR (VAR) model to predict the economic variable
- If traffic flow is a good predictor, then this should give a better estimate of GDP
Results
IFrame("figures/actual_vs_AR_predictions.html",
       width=800,
       height=600
      )
Caveats
- Small timeseries
- In-sample predictions
- Recession is an outlier, may be biasing correlations
- Does give some indication that this could work (with better data and methods)
Overall Summary
- Weekly earnings, GDP and unemployment look like good candidates, like Stats Netherlands
- Though no correlation with inflation
- Evidence that traffic flow can be used as an early indicator for economic measures
- Need more data to allow for more sophisticated methods
Daily traffic flow trends
Daily traffic flow showing mean 15 min traffic counts averaged across previous 91 days
IFrame("figures/quarterly_smoothed_daily_time_series_multi_metrics_small.html",
       width=800,
       height=600
      )
Annual components of traffic flow data
Trends
IFrame("figures/trends_traffic_flow_decomposition.html",
       width=800,
       height=400
      )
Yearly component
IFrame("figures/seasons_trends_traffic_flow_decomposition.html",
       width=800,
       height=400`
      )
Residuals
IFrame("figures/resids_trends_traffic_flow_decomposition.html",
       width=800,
       height=400
      )